| |
|
|
|
|
|
|
|
|
|
|
|
Table 1.
Overview of the World Economic Outlook
Projections
(Percent change unless
otherwise noted) |
|
|
|
|
Year over Year |
|
|
|
|
| |
|
|
|
|
|
Difference from April 2011 WEO
Projections |
|
Q4 over Q4 |
| |
|
|
Projections |
|
|
Estimates |
Projections |
|
|
2009 |
2010 |
2011 |
2012 |
|
2011 |
2012 |
|
2010 |
2011 |
2012 |
|
|
|
World Output1 |
–0.5 |
5.1 |
4.3 |
4.5 |
|
–0.1 |
0.0 |
|
4.7 |
4.3 |
4.4 |
|
Advanced Economies |
–3.4 |
3.0 |
2.2 |
2.6 |
|
–0.2 |
0.0 |
|
2.7 |
2.3 |
2.6 |
| United
States |
–2.6 |
2.9 |
2.5 |
2.7 |
|
–0.3 |
–0.2 |
|
2.8 |
2.6 |
2.5 |
| Euro
Area |
–4.1 |
1.8 |
2.0 |
1.7 |
|
0.4 |
–0.1 |
|
2.0 |
1.8 |
2.0 |
|
Germany |
–4.7 |
3.5 |
3.2 |
2.0 |
|
0.7 |
–0.1 |
|
3.8 |
2.6 |
2.4 |
|
France |
–2.6 |
1.4 |
2.1 |
1.9 |
|
0.5 |
0.1 |
|
1.4 |
2.0 |
2.1 |
|
Italy |
–5.2 |
1.3 |
1.0 |
1.3 |
|
–0.1 |
0.0 |
|
1.5 |
1.3 |
1.2 |
|
Spain |
–3.7 |
–0.1 |
0.8 |
1.6 |
|
0.0 |
0.0 |
|
0.6 |
0.9 |
2.0 |
| Japan |
–6.3 |
4.0 |
–0.7 |
2.9 |
|
–2.1 |
0.8 |
|
2.4 |
0.8 |
2.2 |
| United
Kingdom |
–4.9 |
1.3 |
1.5 |
2.3 |
|
–0.2 |
0.0 |
|
1.5 |
2.0 |
2.4 |
| Canada |
–2.8 |
3.2 |
2.9 |
2.6 |
|
0.1 |
0.0 |
|
3.3 |
2.7 |
2.7 |
| Other
Advanced Economies2 |
–1.1 |
5.8 |
4.0 |
3.8 |
|
0.1 |
0.0 |
|
4.7 |
4.0 |
4.3 |
|
Newly Industrialized Asian Economies |
–0.7 |
8.4 |
5.1 |
4.5 |
|
0.2 |
0.0 |
|
5.9 |
5.1 |
5.3 |
|
Emerging and Developing Economies3 |
2.8 |
7.4 |
6.6 |
6.4 |
|
0.1 |
–0.1 |
|
7.5 |
6.9 |
6.6 |
| Central
and Eastern Europe |
–3.6 |
4.5 |
5.3 |
3.2 |
|
1.6 |
–0.8 |
|
4.9 |
5.1 |
2.2 |
|
Commonwealth of Independent States |
–6.4 |
4.6 |
5.1 |
4.7 |
|
0.1 |
0.0 |
|
4.5 |
5.2 |
3.6 |
|
Russia |
–7.8 |
4.0 |
4.8 |
4.5 |
|
0.0 |
0.0 |
|
4.3 |
5.3 |
3.4 |
|
Excluding Russia |
–3.0 |
6.0 |
5.6 |
5.1 |
|
0.1 |
0.0 |
|
. . . |
. . . |
. . . |
|
Developing Asia |
7.2 |
9.6 |
8.4 |
8.4 |
|
0.0 |
0.0 |
|
9.2 |
8.4 |
8.6 |
|
China |
9.2 |
10.3 |
9.6 |
9.5 |
|
0.0 |
0.0 |
|
9.8 |
9.4 |
9.5 |
|
India |
6.8 |
10.4 |
8.2 |
7.8 |
|
0.0 |
0.0 |
|
9.7 |
7.7 |
8.0 |
|
ASEAN-54 |
1.7 |
6.9 |
5.4 |
5.7 |
|
0.0 |
0.0 |
|
6.0 |
5.4 |
5.8 |
| Latin
America and the Caribbean |
–1.7 |
6.1 |
4.6 |
4.1 |
|
–0.1 |
–0.1 |
|
5.4 |
4.3 |
4.0 |
|
Brazil |
–0.6 |
7.5 |
4.1 |
3.6 |
|
–0.4 |
–0.5 |
|
5.0 |
4.3 |
3.7 |
|
Mexico |
–6.1 |
5.5 |
4.7 |
4.0 |
|
0.1 |
0.0 |
|
4.4 |
4.4 |
3.7 |
| Middle
East and North Africa |
2.5 |
4.4 |
4.2 |
4.4 |
|
0.1 |
0.2 |
|
. . . |
. . . |
. . . |
|
Sub-Saharan Africa |
2.8 |
5.1 |
5.5 |
5.9 |
|
0.0 |
0.0 |
|
. . . |
. . . |
. . . |
|
Memorandum |
|
|
|
|
|
|
|
|
|
|
|
| European
Union |
–4.1 |
1.8 |
2.0 |
2.1 |
|
0.2 |
0.0 |
|
2.1 |
1.9 |
2.3 |
| World
Growth Based on Market Exchange Rates |
–2.1 |
4.0 |
3.4 |
3.7 |
|
–0.1 |
0.0 |
|
. . . |
. . . |
. . . |
| |
|
|
|
|
|
|
|
|
|
|
|
|
World Trade Volume (goods and services) |
–10.8 |
12.4 |
8.2 |
6.7 |
|
0.8 |
–0.2 |
|
. . . |
. . . |
. . . |
| Imports |
|
|
|
|
|
|
|
|
|
|
|
|
Advanced Economies |
–12.5 |
11.6 |
6.0 |
5.1 |
|
0.2 |
–0.4 |
|
. . . |
. . . |
. . . |
|
Emerging and Developing Economies |
–7.9 |
13.7 |
12.1 |
9.0 |
|
1.9 |
–0.4 |
|
. . . |
. . . |
. . . |
| Exports |
|
|
|
|
|
|
|
|
|
|
|
|
Advanced Economies |
–12.0 |
12.3 |
6.8 |
6.1 |
|
0.0 |
0.2 |
|
. . . |
. . . |
. . . |
|
Emerging and Developing Economies |
–7.9 |
12.8 |
11.2 |
8.3 |
|
2.4 |
–0.4 |
|
. . . |
. . . |
. . . |
|
Commodity Prices (U.S. dollars) |
|
|
|
|
|
|
|
|
|
|
|
| Oil5 |
–36.3 |
27.9 |
34.5 |
–1.0 |
|
–1.1 |
–1.8 |
|
. . . |
. . . |
. . . |
| Nonfuel
(average based on world commodity export weights) |
–15.7 |
26.3 |
21.6 |
–3.3 |
|
–3.5 |
1.0 |
|
. . . |
. . . |
. . . |
| |
|
|
|
|
|
|
|
|
|
|
|
|
Consumer Prices |
|
|
|
|
|
|
|
|
|
|
|
| Advanced
Economies |
0.1 |
1.6 |
2.6 |
1.7 |
|
0.4 |
0.0 |
|
1.6 |
2.6 |
1.6 |
| Emerging
and Developing Economies3 |
5.2 |
6.1 |
6.9 |
5.6 |
|
0.0 |
0.3 |
|
6.2 |
5.8 |
5.0 |
|
London Interbank Offered Rate (percent)6 |
|
|
|
|
|
|
|
|
|
|
|
| On U.S.
Dollar Deposits |
1.1 |
0.5 |
0.6 |
0.8 |
|
0.0 |
–0.1 |
|
. . . |
. . . |
. . . |
| On Euro
Deposits |
1.2 |
0.8 |
1.7 |
2.6 |
|
0.0 |
0.0 |
|
. . . |
. . . |
. . . |
| On
Japanese Yen Deposits |
0.7 |
0.4 |
0.5 |
0.2 |
|
–0.1 |
–0.1 |
|
. . . |
. . . |
. . . |
|
|
|
Note: Real effective exchange rates
are assumed to remain constant at the levels
prevailing during April 14–May 12, 2011. When
economies are not listed alphabetically, they are
ordered on the basis of economic size. The
aggregated quarterly data are seasonally adjusted. |
|
1The
quarterly estimates and projections account for 90
percent of the world purchasing-power-parity
weights. |
|
2Excludes
the G7 and euro area countries. |
|
3The
quarterly estimates and projections account for
approximately 80 percent of the emerging and
developing economies. |
|
4Indonesia,
Malaysia, Philippines, Thailand, and Vietnam. |
|
5Simple
average of prices of U.K. Brent, Dubai, and West
Texas Intermediate crude oil. The average price of
oil in U.S. dollars a barrel was $79.03 in 2010; the
assumed price based on futures markets is $106.30 in
2011 and $105.25 in 2012. |
|
6Six-month
rate for the United States and Japan. Three-month
rate for the euro area. |
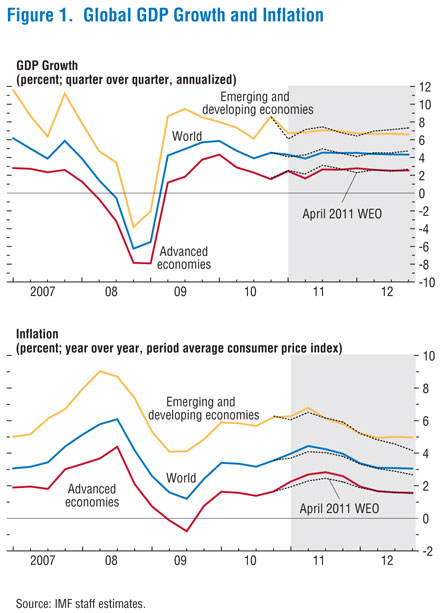
Inflation has risen
Global inflation picked up from 3½ percent in the last
quarter of 2010 to 4 percent in the first quarter of 2011, more
than ¼ percentage point higher than projected in the
April 2011 World Economic Outlook (Figure
1:
CSV|PDF,
bottom panel). Inflation accelerated mainly because of
larger-than-expected increases in commodity prices. However,
core inflation also crept up across a number of economies. Among
advanced economies, core inflation remained subdued in the
United States and Japan and rose moderately in the euro area.
Among emerging and developing economies, inflation pressures
have become increasingly broad-based, reflecting a higher share
of food and fuel in consumption as well as accelerating demand
pressure.
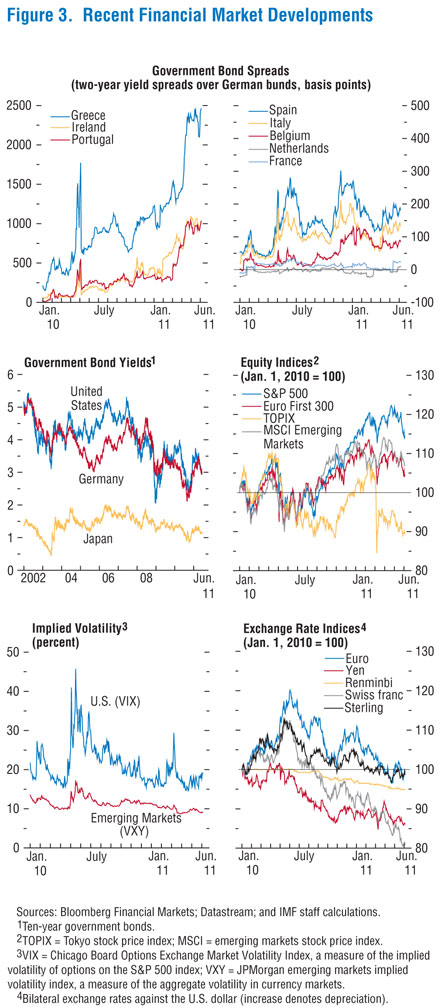
 Financial volatility has increased
After easing through much of the first half of 2011, global
financial conditions have become more volatile since late May (Figure
3:
CSV|PDF).
This reflects market concerns about sovereign risks related to
developments in the euro area periphery and the recent softening
in activity and persistent housing market weakness observed in
the United States. Symptoms include rising sovereign credit
default swap spreads in certain euro area economies, retreating
global stock prices, and falling long-term bond yields in the
major advanced economies. In addition, the
June 2011 Global Financial Stability Report (GFSR) Market
Update emphasizes the insufficient pace of progress on
banking system repair, notably in Europe, as well as risks
related to releveraging in various market segments.
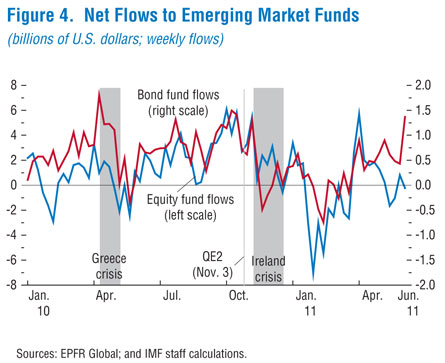
For emerging and developing economies, the financial environment
remains quite accommodative, although with greater variation
across countries. Capital inflows have been fickle (
Figure
4:
CSV|
PDF),
probably reflecting the increased downside risks to the global
economy and domestic policy concerns such as inflation. Some of
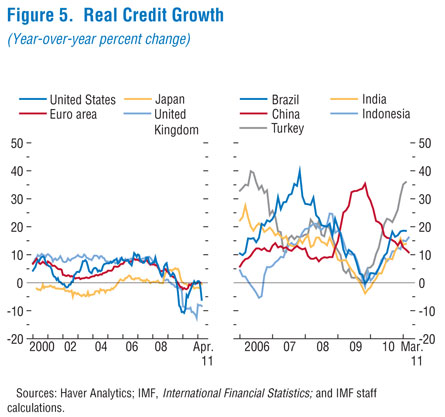
the larger economies are experiencing rapid credit growth,
propelled by accommodative macroeconomic conditions and buoyant
capital flows (
Figure
5:
CSV|
PDF).
In others, credit growth has decelerated with a persistent
tightening of monetary policy. Despite some currency gyrations (
Figure
3:
CSV|
PDF,
bottom panel), exchange rates have not moved much in real
effective terms in recent months.
Commodity prices have stabilized
Commodity markets have experienced volatility since late
April (Figure
6:
CSV|PDF).
After surging through April, commodity prices fell in May. The
corrections partly reflected the unwinding of an earlier buildup
of noncommercial derivative positions with increased general
financial volatility and in reaction to recent data on softer
global economic activity. Prices of crude oil briefly came close
to $120 a barrel in April, fell sharply in May, but have
stabilized since. Current prices average about $107 a barrel,
close to levels assumed in the
April 2011 World Economic Outlook. Food prices also
stabilized beginning in early 2011, following last year’s
weather-related supply shocks.

Growth will slow temporarily
Global activity is projected to slow in the second quarter of
2011, and then reaccelerate in the second half of the year. But
activity will remain unbalanced amid elevated downside risks.
Growth is set to be sluggish in advanced economies facing fiscal
and financial sector balance sheet problems, which will continue
to be a drag on employment. Activity will continue to expand
strongly in advanced economies that do not face such challenges,
as well as in many emerging and developing economies.
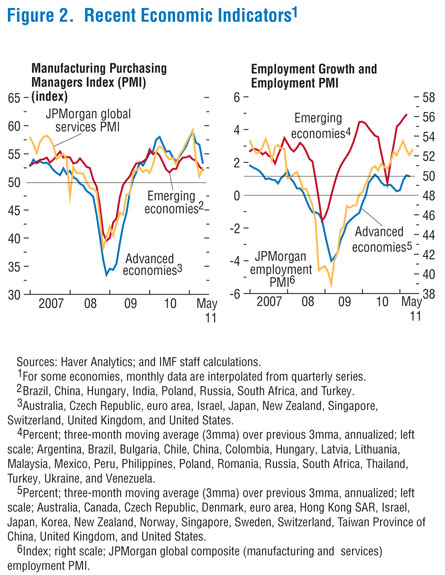
Forward-looking indicators such as manufacturing purchasing
managers indices suggest that activity has softened in the
second quarter of 2011, especially in many advanced economies.
The projected easing in activity comes from more subdued private
consumption, as oil price hikes in previous quarters cut into
households’ real incomes. In addition, the effect of global
supply disruptions from the Japanese earthquake is fully
materializing in the second quarter. However, the fundamental
drivers of growth remain in place: overall still-accommodative
macroeconomic conditions, pent-up demand for consumer durables
and investment, and strong potential growth in emerging and
developing economies. Accordingly, the baseline projections on
global growth and inflation remain broadly unchanged compared
with the
April 2011 World Economic Outlook (Table 1).
Growth in the advanced economies is projected to average
about 2½ percent during 2011–12, slightly weaker than in the
April 2011 World Economic Outlook. This would
represent a modest deceleration from an average of about 3
percent in 2010. For 2011, growth is expected to be weaker than
previously projected in the United States and Japan, partly
offset by stronger activity in core euro area economies. In
2012, the rebound of the Japanese economy from the earthquake is
forecast to offset weaker growth in the United States.
Output growth in emerging and developing economies is
expected to be 6½ percent during 2011–12, compared with about 7½
percent in 2010, in line with the
April 2011 World Economic Outlook projections.
Within this overall picture, prospects vary across regions.
Growth in emerging Asia will decelerate only slightly from the
very high levels of last year. Disruptions to regional
production networks due to supply constraints from Japan appear
contained, although some sectors, especially automobiles and
electronics, could experience strains through the summer. Latin
America will be bolstered by commodity exports and domestic
demand but the pace will ease in some economies where policies
have been tightening more aggressively (see
box). Growth in emerging Europe is now projected to be
higher than previously expected in 2011, followed by a softening
in 2012, driven in part by a sharp domestic demand cycle in
Turkey. Activity is projected to continue strengthening in
sub-Saharan Africa, with domestic demand remaining robust and
commodity exporters benefiting from elevated prices. Economic
prospects in the Middle East and North Africa remain clouded by
political and social unrest, although the outlook has improved
for some oil and mineral exporters.
Increasing downside risks
The balance of risks points down more than at the time of the
April 2011 World Economic Outlook. Downside risks
due to heightened potential for spillovers from further
deterioration in market confidence in the euro area periphery
have risen since April (see the
June 2011 GFSR Market Update). Market concerns
about possible setbacks to the U.S. recovery have also surfaced.
If these risks materialize, they will reverberate across the
rest of the world—possibly seriously impairing funding
conditions for banks and corporations in advanced economies and
undercutting capital flows to emerging economies. In addition,
banks in advanced economies continue to face a wall of
refinancing requirements, and a squeeze on banks’ wholesale
funding could reverse the recent normalization of lending
standards. Near-term risks for sharper or more drawn-out
negative spillovers from Japan to other economies cannot be
ruled out either.
|
Economic Outlook for Latin
America and the Caribbean
Growth remains robust in Latin
America and the Caribbean (LAC) and is projected to
exceed 4½ percent in 2011. The expansion has been
strongest in South America, where high commodity
prices and easy external financing conditions are
fueling domestic demand, which, if left unchecked,
could soon lead to overheating. The recovery in many
Central American and Caribbean countries has gained
some strength, although growth continues to be
constrained by strong real links with slower-growing
advanced economies (particularly the United States),
less favorable terms of trade, and in some cases
high public debt.
Latin America recovered quickly and
strongly from the global financial crisis. In most
countries, prudent, countercyclical policies in the
years leading up to the crisis allowed the
deployment of macroeconomic stimulus to counteract
its effects on activity. The region expanded by more
than 6 percent in 2010, led by South America, where
high commodity prices, easy external financing
conditions, and accommodative macroeconomic policies
stimulated domestic demand. Output gaps have closed
in much of the region and early signs of overheating
are appearing: inflation is rising, current account
deficits are widening, and credit and asset prices
are growing rapidly. Rising global fuel and food
prices are adding to the challenge of containing
inflation and protecting the poor.
LAC growth is projected to moderate
to about 4½ percent in 2011 and to converge to its
potential rate, about 4 percent, over the next two
years. The expansion will continue to be led by
domestic demand, and accompanied by a further
widening in the current account deficit. This
baseline scenario assumes a significant withdrawal
of policy stimulus and some deceleration of private
sector demand, particularly for large commodity
exporters. There are signs that activity is finally
gaining traction in economies with closer real links
to advanced economies, where the recovery has
lagged. However, growth in many Central American and
Caribbean countries will continue to be constrained
by the slow recovery in remittances and tourism and
less favorable terms of trade. High public debt will
require sustained fiscal consolidation in the
Caribbean, which will also pose a drag on growth.
Although downside risks persist for
the world economy, risks for the near-term outlook
in Latin America are somewhat more balanced. GDP
growth could be higher if the assumed policy
tightening does not materialize or proves
insufficient to slow domestic demand. Under this
scenario, however, inflation and current account
deficits could turn out higher than projected,
raising the risk of boom-bust dynamics. On the
downside, a serious tightening in global financial
conditions could lead to a reversal in inflows to
the region and adversely affect its prospects.
With output gaps closed in most
countries, macroeconomic policy accommodation should
be removed. Even though many countries have moved in
recent months to raise policy interest rates, it is
still critical to continue to adjust the policy mix
by reducing the pace of government spending to avoid
placing an excessive burden on monetary policy in
the context of sizable capital inflows and currency
appreciation. In light of strong credit and asset
price growth, countries should also continue to
strengthen macroprudential measures and possibly use
capital controls to enhance the resilience of their
financial systems. In Central America, emphasis must
shift to rebuilding the policy buffers used during
the global recession, while in the Caribbean, where
public debt is very high, fiscal policy will need to
continue with consolidation to ensure economic
stability and set the stage for sustainable growth
in the future.
| |
|
|
|
Selected Western
Hemisphere Economies: Real GDP1
(Annual percent
change) |
| |
|
Projections |
| |
2010 |
2011 |
2012 |
|
|
|
North America |
3.1 |
2.7 |
2.8 |
| Canada |
3.2 |
2.9 |
2.6 |
| Mexico |
5.5 |
4.7 |
4.0 |
| United
States |
2.9 |
2.5 |
2.7 |
| |
|
|
|
|
Central America, Panama, and the Dominican
Republic2 |
4.7 |
4.4 |
4.5 |
| Costa Rica |
4.2 |
4.3 |
4.4 |
| Dominican
Republic |
7.8 |
5.5 |
5.5 |
| Guatemala |
2.8 |
3.0 |
3.2 |
| Panama |
7.5 |
7.4 |
7.2 |
| |
|
|
|
|
Caribbean3 |
-1.3 |
2.7 |
3.5 |
| Eastern
Caribbean Currency Union |
-2.1 |
2.1 |
2.6 |
| Haiti |
-5.1 |
8.6 |
8.8 |
| Jamaica |
-1.2 |
1.4 |
2.4 |
| Trinidad and
Tobago |
-0.6 |
1.8 |
2.6 |
| |
|
|
|
|
South America4 |
6.6 |
4.7 |
4.1 |
| Argentina5 |
9.2 |
6.0 |
4.6 |
| Brazil |
7.5 |
4.1 |
3.6 |
| Chile |
5.2 |
6.2 |
5.0 |
| Colombia |
4.3 |
4.6 |
4.5 |
| Peru |
8.9 |
6.6 |
5.9 |
| Venezuela |
-1.5 |
3.3 |
3.9 |
| |
|
|
|
|
Latin America and the Caribbean6 |
6.1 |
4.6 |
4.1 |
|
|
|
Source: IMF, World Economic
Outlook database. |
|
1Regional
growth rates weighted by GDP valued at
purchasing power parities. Selected
countries comprise at least 70 percent of
output for each subregion. |
|
2Includes
also Belize, El Salvador, Honduras, and
Nicaragua. |
|
3Includes
also The Bahamas and Barbados. Eastern
Caribbean Currency Union includes Antigua
and Barbuda, Dominica, Grenada, St. Kitts
and Nevis, St. Lucia, and St. Vincent and
the Grenadines, and the United Kingdom
territories of Anguilla and Montserrat. |
|
4Includes
also Bolivia, Ecuador, Guyana, Paraguay,
Suriname, and Uruguay. |
|
5Private
analysts are of the view that real GDP
growth was significantly lower than the
official estimates in 2008 and 2009,
although the discrepancy between private and
official estimates of real GDP growth
narrowed in 2010. |
|
6Includes
Mexico and economies from the Caribbean,
Central America, and South America. |
|
Regarding commodities, risks are smaller than projected in
April but still point down for growth. Unrest in the Middle East
may raise oil prices. Although pressures in food markets have
eased somewhat, low inventories and weather-related supply
disruptions present significant near-term upside risk for
prices.
Fiscal challenges continue to pose various risks for the
recovery. A first set of concerns revolves around fiscal
imbalances in the euro area periphery. A second set involves the
large near-term fiscal adjustment in the United Sates against a
still-fragile recovery. A third set of concerns centers on
medium-term fiscal sustainability in the United States and
Japan. In the United States, these risks are rising because of
the absence of credible consolidation and reform plans, while
Japan’s plans must be made sufficiently ambitious and be
implemented. In Japan, the fiscal response to the earthquake has
raised challenges to attaining medium-term fiscal
sustainability. Some credit rating agencies have already put
U.S. and Japanese sovereign credit ratings on negative watch.
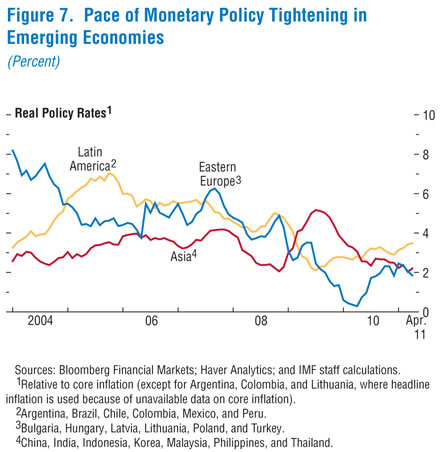
Overheating pressures in some key emerging economies have
also intensified as observed in elevated inflation pressures,
and in some cases high asset prices. While some economies have
tightened at a faster pace, others have fallen somewhat behind
the curve (Figure
7:
CSV|PDF).
The longer policy rates stay low, the larger the chances of a
hard landing in the future.
Upside risks from stronger investment by a generally healthy
corporate sector in advanced economies, or buoyant near-term
activity in emerging and developing economies, are broadly at
the same level as estimated in the
April 2011 World Economic Outlook.
Policies need to steer
away from unbalanced growth
The global economy has turned the corner from the Great
Recession. However, securing the transition from recovery to
expansion will require a concerted effort at addressing diverse
challenges.
The key fiscal priority for major advanced
economies—especially the United States and Japan—is to implement
credible and well-paced consolidation programs focused on
bolstering medium-term debt sustainability. Given the tepid
recoveries in these economies thus far, consolidation should
ideally be gradual and sustained, so as not to undermine growth
prospects. For the United States, it is critical to immediately
address the debt ceiling and launch a deficit reduction plan
that includes entitlement reform and revenue-raising tax reform.
Should the recovery threaten to turn out substantially weaker
than currently projected, the pace of fiscal adjustment should
be modified accordingly, within the envelope of a credible
medium-term consolidation plan. Similarly, Japan needs to make
progress in tax and entitlement reforms to alleviate its
worrisome debt dynamics. Further fiscal issues are discussed in
the
June 2011 Fiscal Monitor Update.
Advanced economies must also address the financial sector
vulnerabilities that were at the root of the crisis. In this
regard, the situation is more critical in various European
economies than elsewhere. In the euro area periphery, there is
no way around ambitious structural reforms to boost
competitiveness and revive employment growth, along with
front-loaded fiscal adjustment and balance sheet repair to
restore market confidence and ameliorate the pressure on
sovereign and bank spreads. These efforts need to be flanked
with concrete steps to strengthen EU-wide supervision and crisis
resolution, including by making the safety net more flexible.
In advanced economies with still-sizable economic slack and
continued drag from fiscal and financial sector consolidation,
monetary policy should stay accommodative—this includes the
United States, Japan, and the euro area. As the recovery
proceeds and economic slack diminishes more broadly, however,
central banks must guard against further increases in core
inflation. Importantly, accommodative monetary policy cannot
become a substitute for insufficient financial sector repair. In
the meantime, macroprudential policies and stronger financial
supervision can help contain risks flowing from a prolonged
period of low interest rates.
In a number of emerging and developing economies that are
already operating at or above precrisis levels of output, the
priority is to expeditiously tighten macroeconomic policies, and
use exchange rate flexibility and macroprudential tools,
possibly including capital controls, to help contain risks of
boom-bust cycles. While many emerging and developing economies
are already raising policy rates, real rates still remain low.
Thus, policy tightening must continue, coordinated with
transparent central bank communication to anchor inflation
expectations. Economies with high fiscal deficits or debt also
need to rebuild room for fiscal policy maneuver, especially
those that are susceptible to external shocks or have sharply
widening current account deficits (or currencies approaching
overvaluation ranges). At the same time, social sector spending
and priority infrastructure investment must be preserved. For
economies with excessive current account surpluses, particularly
in Asia, demand rebalancing—through exchange rate appreciation
and structural reforms—remains a top priority for securing
balanced growth and employment gains in the medium term.